Stone Energy (SGY) trade idea
The SGY 1.75% convertible bonds due 3/1/17 trade at 89.75 vs. $20.81. Using 500 credit, the converts imply 31 vol., which is cheap to 100 day realized vol. of 41 and options implied vol. in the mid 40s. The 500 credit spread assumption is based on the trading levels of SGY’s 8.625% bonds due 2/1/17 and 7.5% bonds due 11/15/22 (both pari passu with same subsidiary guarantees as converts).
The yield/premium relationship does not look good optically but if we set the converts up on a 40 delta, the converts cross par (at 31.95) at a reasonable 33% premium, which is also where the converts were issued about 10 months ago. The converts traded +3 on the first day. Using 500 credit and 35 vol. at that stock price values the converts at 103, using 500 and 40, the converts are valued at 105.
We can also sell 21 strike Jun call options for 2.4 to generate income. Per 1m converts, we can sell 50 call options on a 55 delta. This would generate up to 1.2 points in income with breakevens at $17 and $26 with an effective delta of 40 and stock delta of 29.
The key to this trade is to be comfortable with the credit so that the converts can be set up on a 40 and still be able to make money (or at least hold value) to the downside. I am comfortable with the credit due to SGY’s strong liquidity ($250m cash and $400m undrawn revolver), its large reserves ($21/share of proven reserves), and its oil hedges on 61% of oil production at $98.87. There is no secured debt ahead of the converts and senior notes. I also feel that the stock is trading near the low end of its valuation range of $20 to $30.
SGY has no maturities until 2017 when the converts and 8.625% bonds mature and although the company is not expected to be free cash flow positive in 2013, it has more than enough cash on hand and undrawn revolver to fund its cash needs in even the most dire scenarios. SGY should be free cash flow positive in 2014. The converts are pari passu with the bond with identical subsidiary guarantees, rated B- by S&P, and there is no debt ahead of it in the capital structure.
Business description
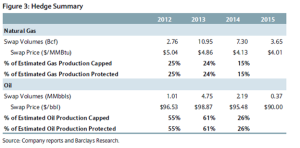
SGY is an independent oil and gas company with properties in the Gulf of Mexico Deepwater (21% of proved reserves), GOM shallow water shelf (50% reserves), Marcellus shale (28% of reserves) and Eagle Ford shale (1% reserves). About 50% of 2013 production will come from oil and 50% from natural gas. The company has hedged out 47% of total 2013 production (61% of 2013 oil production at $98.87 and 24% of gas production at $4.86) and 31% of total 2014 production. All the oil comes from GOM which is priced at a $20 premium to WTI.
Capital structure
Cash = $250m (pro-forma 7.5% senior note issued on 10/23/12)
Undrawn credit facility = $400m
Debt = $975m
$300m = 1.75% converts due 3/1/17
$375m = 8.625% bonds due 2/1/17
$300m = 7.5% bonds due 11/15/22
Market cap = $1.03B
Expected capex 2013 = $650m
Expected cash flow from operations 2013 = $550m
Expected cash needs 2013 = $100m
Equity valuation
SGY currently trades at 9.8x 2013 estimated EPS of $2.12, down from $3.40 as recently as July mostly due to tightness in the deepwater rig market. The company had expected a platform rig to be on location at Pompano in 2013 but that has now been pushed back to mid-2014. SGY’s shallow water drilling will also be delayed by several months due to tightness in jack-up rigs. Although, 2013 EPS estimates were lowered, the company is set up well for a ramp up in EPS to over $3 in 2014.
A good way to value E&P companies is to look at the sum of the parts broken down by proven reserves, unproven reserves, and net debt. E&P stocks typically trade between the value of proved reserves and unproven reserves (net of debt).
For SGY, the stock should trade between $21 (value of proven reserves) and $31 (value of proved and unproved reserves) at current oil and gas prices. This leaves significant upside potential for the stock. Additionally, SGY has the potential to add to its proved and unproved reserves through new exploration and development. (After the close on 1/15/13, SGY announced that it had grown its proved reserves by 28% from last year.)
|
Oil |
Gas |
Oil and Gas |
|
|
|
(MBbls) |
MMCF |
Mmcfe |
Value ($mil) |
|
| Proved |
|
|
|
|
| Developed |
31,026 |
174,067 |
360,224 |
1,066 |
| Undeveloped |
14,728 |
153,285 |
241,656 |
715 |
| Total Proved |
45,754 |
327,352 |
601,880 |
1,782 |
|
|
||||
| Total Unproved |
500 |
|||
|
|
||||
| Total Proved and Unproved |
2,282 |
|||
| Net Debt |
725 |
|||
| Shares outstanding |
|
|
|
50 |
|
|
|
|
|
|
| Per share proved reserves |
$21.13 |
|||
| Per share unproved reserves |
$31.13 |
|||
|
|
|
|
|
Cash flow scenario analysis
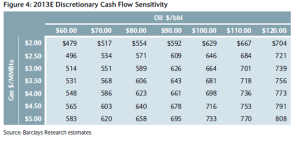
Based on Barclay’s research, the following table details SGY’s cash flows based on different realized oil and natural gas prices. Even in a stressed scenario of $60 oil and $2 gas, SGY would be able to generate $479m in operating cash flow (due largely to hedges detailed in the next table). With $650m of liquidity and no maturities, the company could easily cover $650m of capex, which in reality would likely be less due to the lower energy prices.
Capex budget
The company’s expected 2013 budget of $650 will go towards the following:
1) 29% on deep water projects covering Pompano infrastructure and exploration activities
2) 27% on development wells and facilities on continental shelf
3) 8% on a third La Cantera deep gas well and related exploration
4) 36% onshore, liquids rich areas of Marcellus, and exploration in Eagle Ford
Convert specifics
Pay dates March 1 and Sept 1
Record date
Get last coupon before maturity if converting
Convertible only if stock is 130% of conversion price for 20 of 30 days ending the previous quarter.
SGY can choose settlement in cash, stock or a combination of cash and stock
Flat PNL on cash takeout at $32
Fully adjusted for cash dividends

